

Geek out on data and use the FIG website to its fullest. Use the biophysical regions map, graphs, and pie charts to discover for yourself how Maine forests are changing over time.
Here are analysis ideas for the amount of data you have to work with. What are you most curious to figure out?
ONE PLOT, ONE YEAR OF DATA
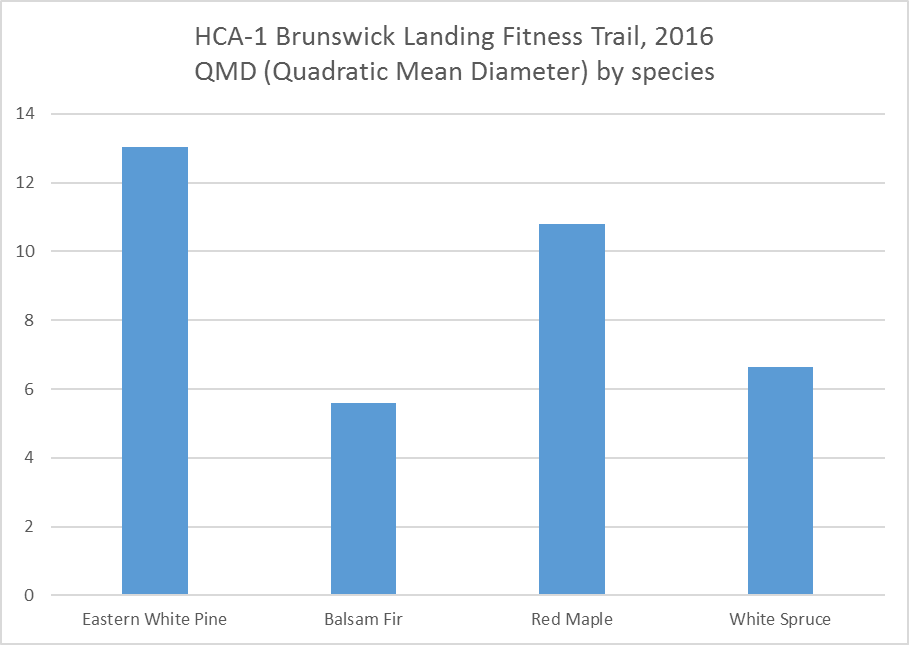
What is the Plot’s Species Composition?
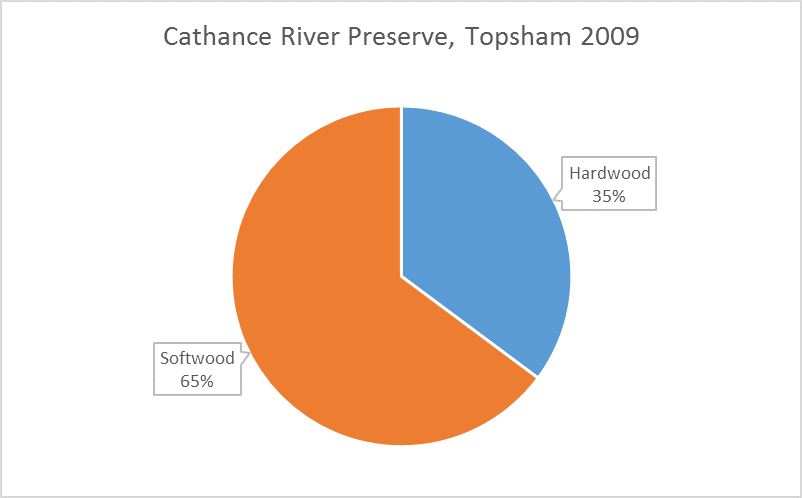

What is Our Plot’s Stage of Development?
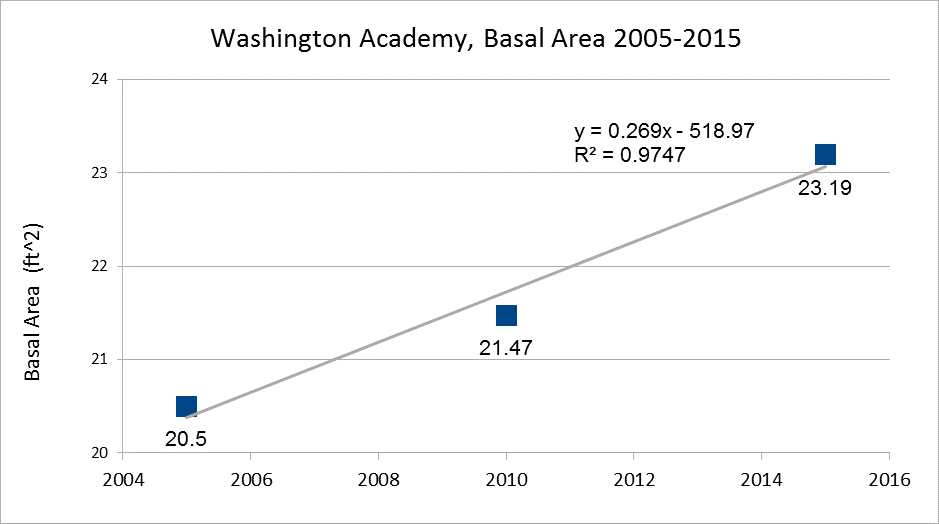
ONE PLOT, TWO OR MORE YEARS OF DATA
How Does Basal Area Change Over 2 Years? 5 Years? 10 Years?
TWO PLOT, ONE OR MORE YEARS OF DATA
Is Species Composition Similar Or Different Across Bioregions?

